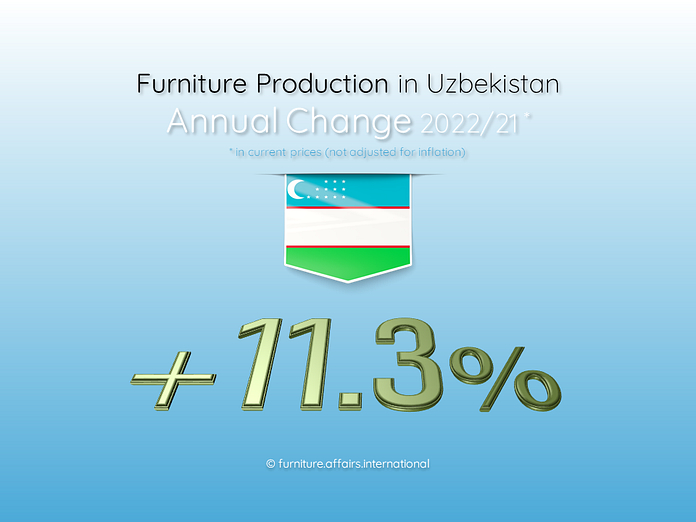
From January to December 2022, the furniture production volume in Uzbekistan reached 3,404 billion soums. This represents a 11.3% increase to the corresponding period of the previous year in current prices, not adjusted for inflation. Furniture production in physical terms (units) increased by 1.3% year-over-year in the period under review.
The reported amount is an equivalent of 308 million USD. The average currency exchange rate was 11,045.70 UZS for 1 USD since the beginning of the year, and 11,243.10 UZS for 1 USD in the recent month reported.
Rising costs of raw materials and components all over the world, as well as geopolitical shifts, contribute to the rise in prices for Uzbekistan-made furniture, too. If taking into account the furniture manufacturers’ price change (+12.7%) in the reporting year, the production volume dynamics in real terms, adjusted for inflation, amounts to minus 1.4%.
In December itself, the monthly production volume was down by 17.7% compared with the same period a year ago.
The production data provided here is a preliminary estimate made by The State Committee of the Republic of Uzbekistan on Statistics are subject to change later on. The updated numbers and most actual data shall be included into our extended Market Reports.


